Chrome DevTools Hidden Gems
A few days ago, I was working on a project and I needed to debug a specific media query to check if it was working as expected. I was using Chrome DevTools, and I was trying to find a way to debug the media query without having to resize the browser window or resize the device toolbar.
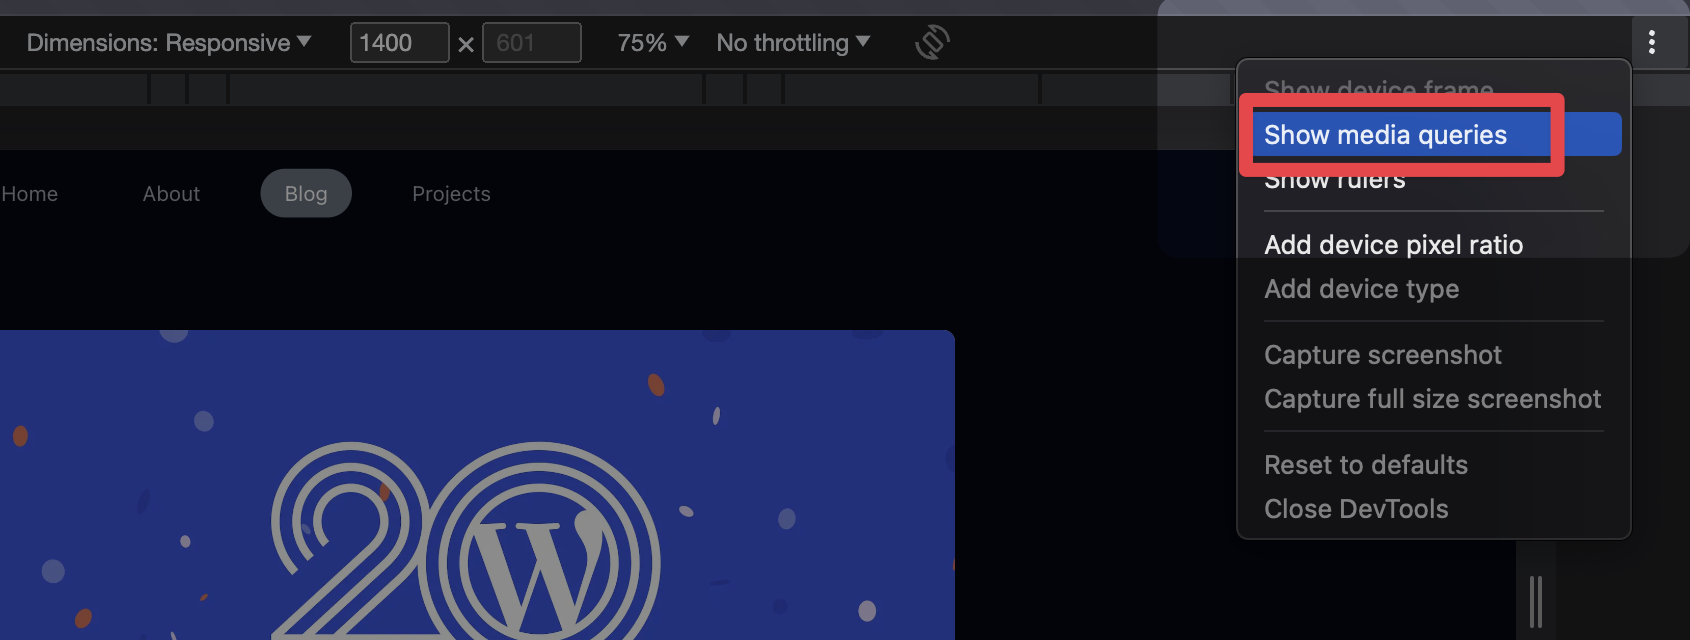
I found a way to show the media query that is currently being applied to the page, and I thought it would be nice to share it. Basically, we just need to open the device toolbar and click on the three dots icon in the top-right corner. Then, we have to click on the "Show media queries" option. After that, we will be able to see the media query that is currently being applied to the page. If we hover over the media query, we will be able to see the media query range, also, each color represents a different source of media queries (if you have more than one).
- With the dev tools open, click on the device toolbar icon (or press Ctrl + Shift + M if you're using Windows, and Cmd + Shift + M if you're using Mac).
- Click on the three dots icon on the top-right corner.
- Click on the "Show media queries" option.
- If you click on one of the media queries with the right mouse button, you will be able to see where is the media query being defined (example on the video).
Demo video
This article was just a quick tip, but there are a lot of other hidden gems in Chrome DevTools and I will try to share more of them in the future. If you want to learn more about Chrome DevTools, I recommend you to check out the Chrome DevTools documentation. If you have any questions or suggestions, feel free to reach out to me on Twitter or on Mastodon.